Syntax
qOut = sw_qscan(qLim)
Description
qOut = sw_qscan(qLim) generates connected lines between given
positions in \(n\)-dimensional space (\(n>1\)). The output contains equally
spaced points along each line section in a matrix, by default 100
points. The function can be used to generates points along a path
defined by corner points.
Input Arguments
qLim- Cell that contains row vectors with \(n\) elements each and optionally an
additional integer, e.g.
{[0 0] [1 0] 201}.
Examples
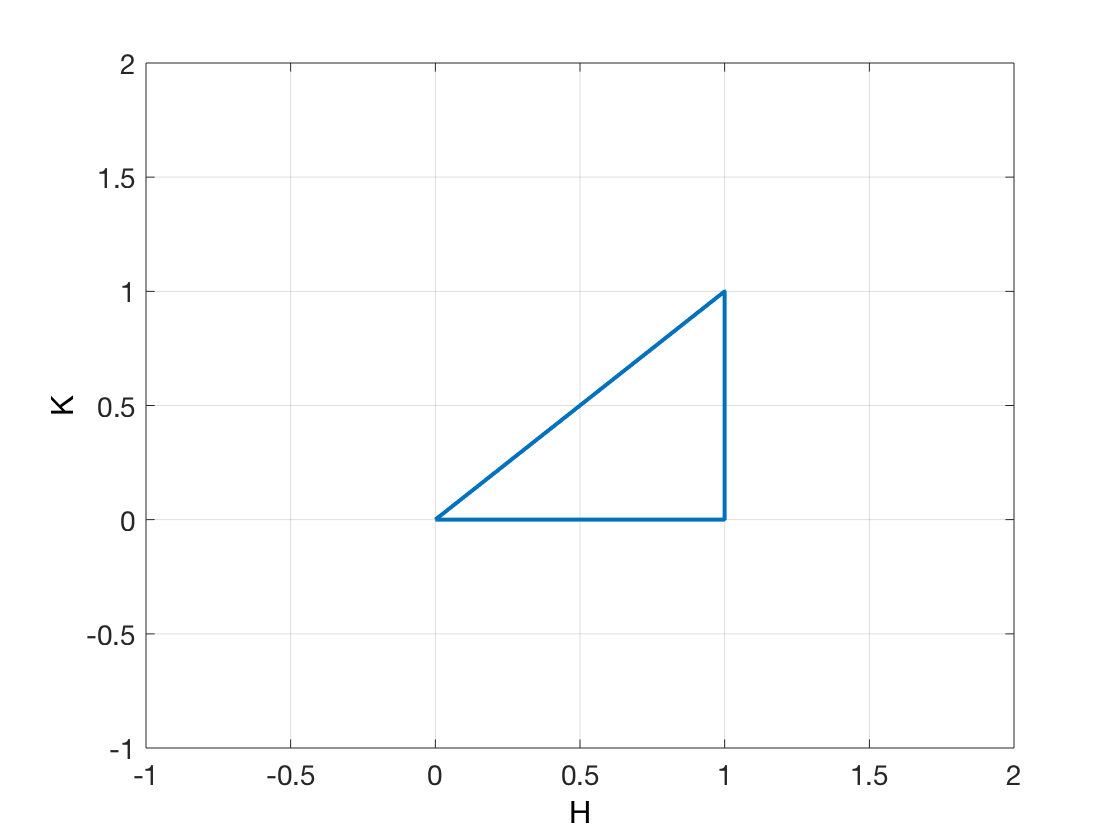
To generate a path in the Brillouin-zone between the \((0,0,0)\), \((1,0,0)\) and \((1,1,0)\) points with 501 points per line segment use:
Q = sw_qscan({[0 0 0] [1 0 0] [1 1 0] [0 0 0] 501});
plot(Q(1,:),Q(2,:),'linewidth',2)
xlabel H
ylabel K